Earlier this year, we introduced V70 of the Vodia PBX. With this build we focused on operational scale, administrative clarity, and improved infrastructure visibility for modern PBX deployments. V70 also introduced major additions including AI voice agents, built-in dashboards, WhatsApp Business integration, and integrated Jitsi video conferencing.
As organizations continue managing larger and more distributed PBX environments, operational oversight becomes increasingly important. To support this, we are introducing Vodia Monitor, a self-hosted monitoring platform that provides centralized visibility across Vodia PBX systems, infrastructure, connectivity, and operational health.
Vodia Monitor helps administrators and service providers monitor uptime, trunks, registrations, certificates, ports, tenant activity, alerts, and infrastructure events, all from a single interface.
What is a PBX fleet?
A PBX fleet comprises a centralized and managed group of phone systems, deployed across companies, departments, and physical sites, all interconnected to function as a single communication environment. These deployments help organizations manage internal and external voice communication by enabling centralized control over telephone lines, extensions, routing, permissions, auto attendants, messaging, voicemail, and call handling through a single interface.
As PBX fleets grow, maintaining visibility across servers, trunks, registrations, certificates, connectivity, tenant activity, and infrastructure health becomes increasingly complex. Vodia Monitor was designed to simplify this operational oversight by centralizing monitoring, alerts, infrastructure awareness, historical tracking, and operational insights across Vodia PBX environments.
Fleet monitoring for Vodia PBX systems
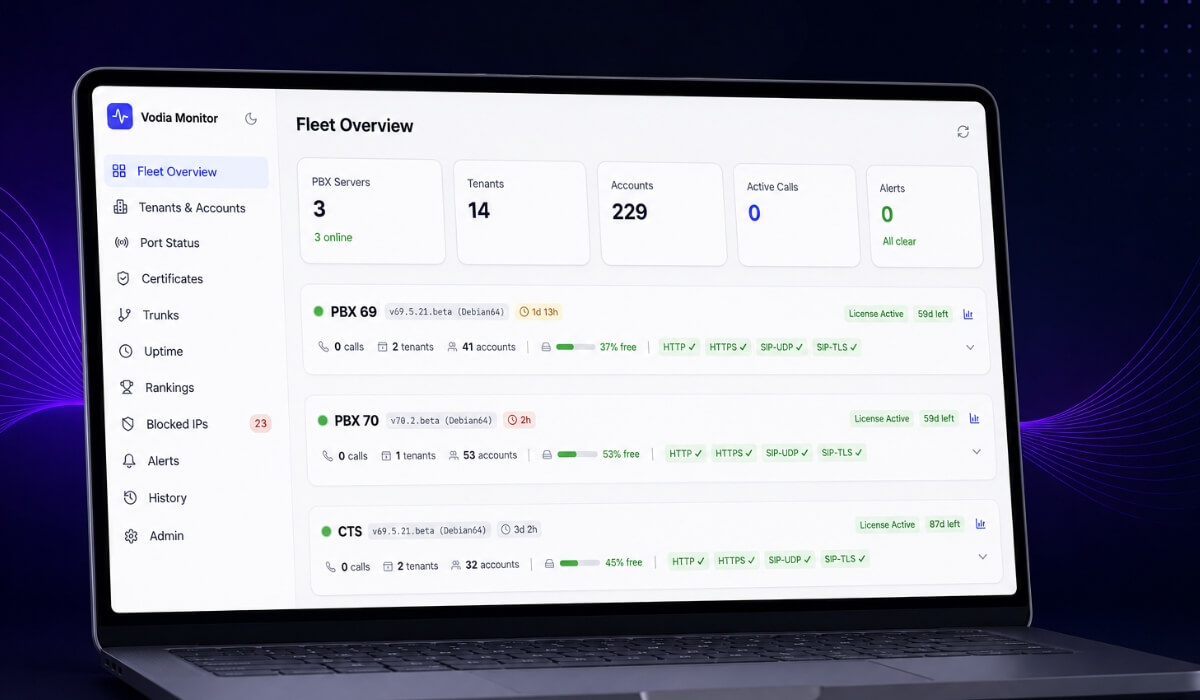
Vodia Monitor is a self-hosted platform that gives operators real-time insights into every Vodia PBX server in their fleet. It tracks uptime, port connectivity, TLS certificates, SIP trunks, blocked IPs, tenant activity, and configuration changes from a single, easy-to-use dashboard.
Vodia Monitor features
In keeping with our commitment to providing Vodia users with a comprehensive suite of features for improved, seamless, and secure business communication, Vodia Monitor includes:
- Alerts: Critical event notifications for port outages, registration drops, certificate expiry, and more
- AI health summaries: one-click AI-generated fleet health summaries via OpenAI, Claude, or Gemini
- Blocked IPs: real-time blocklist with country attribution, connection logs, and historical totals
- Certificates: TLS certificate monitoring with expiry tracking, chain validation, and per-tenant on-demand checks
- Fleet overview: at-a-glance status across all PBX servers, including active calls, tenants, accounts, license expiry, disk usage, and port health
- History: PBX configuration change log and admin login audit trail across your fleet
- Port status: live HTTP, HTTPS, SIP-UDP, and SIP-TLS connectivity checks with per-port response times
- Rankings: fleet-wide comparisons by extension count, account types, call peaks, CPU, memory, and registrations
- Tenants and accounts: full breakdown of every tenant and account type across your fleet (extensions, queues, IVRs, attendants, ring groups, and more)
- Trunks: SIP trunk registration status across all tenants and PBX servers, with per-trunk detail and a call simulator
- Uptime: per-server and per-port uptime percentages with hourly heatmaps and downtime event logs
Benefits of centralized PBX monitoring
Vodia Monitor helps administrators move beyond simply observing infrastructure status. With centralized visibility into alerts, trends, registrations, ports, trunks, and configuration changes, teams can identify anomalies faster, prioritize operational issues, and respond with greater confidence and efficiency.
For service providers and enterprises managing multiple PBX systems, this means:
- Faster troubleshooting across distributed deployments
- Improved monitoring across tenants and systems
- Centralized management without switching between interfaces
- Easier identification of degraded services or abnormal activity
- Better oversight of certificates, connectivity, and infrastructure health
- Lower operational costs by reducing manual monitoring across distributed PBX systems
The platform is particularly valuable for organizations operating across multiple offices, facilities, or customer environments where maintaining operational awareness and infrastructure oversight becomes increasingly difficult as deployments scale.
Documentation
Read the Vodia Monitor documentation for deployment, monitoring, alerts, uptime tracking, and PBX infrastructure management.
Vodia Monitor extends the capabilities of V70 with centralized monitoring, infrastructure awareness, historical tracking, and operational insights across distributed PBX deployments. Looking for the perfect solution for managing your communication - and collaboration - at multiple locations? Contact us at sales@vodia.com or +1 (617) 861-3490.
.svg)