Monitoring Your Vodia PBX: Ensuring Continuous Communication
Published on:
May 15, 2025
The Vodia PBX comes equipped with powerful built-in monitoring tools and integration options to ensure seamless, uninterrupted communication. From real-time system graphs and syslog analysis to packet capture tracking and detailed CDRs, Vodia enables proactive issue detection, performance optimization, and enhanced call quality. With support for SNMP, Prometheus, and external services like Pingdom and Site24x7, you can monitor everything from registration anomalies to system resource usage and SIP connectivity across multiple servers—all in one comprehensive solution.
Regardless of your industry, work environments, both traditional and hybrid, seem to be moving at the speed of light. And no matter what you do, where you do it, or how you do it, you need a best-in-class communication system to succeed.
The industry-standard Vodia phone system is the most cost-effective, feature-rich, and scalable communication solution for both enterprises and SMBs, but how can you make sure it performs optimally? Vodia provides a suite of built-in tools and integration options to facilitate robust monitoring which, in turn, makes it so our customers can detect issues, optimize call quality, and ensure uninterrupted communication for their businesses. Keeping your Vodia PBX healthy is crucial for uninterrupted communication, while 24/7 monitoring and proactive alerts are essential for promptly addressing potential issues.
Let’s take a look at this suite of tools and how it ensures your PBX is operating at full steam and giving you the Quality of Service (QoS), issue detection, performance optimization, and compliance and reporting you expect from Vodia.
Integrated Monitoring Capabilities
Vodia gives you status system graphs, so you can access vital performance metrics for your PBX via the web interface - this enables you to monitor key indicators, including call quality, registration changes, media and main CPU usage, and HTTP/S statistics. Check out our documentation for the status system graphs.
Syslog/Logfile Analysis
Our syslog/logfile analysis makes it so you can leverage comprehensive logging for in-depth troubleshooting:
Configure granular logging to capture specific events (e.g., webclient events, REGISTER requests).
Forward logs to an external syslog server (e.g., 1.1.1.1:555) for centralized analysis.
Graylog can extract data like PBX domains, transport layers, client IPs, and geolocation for detailed analysis - an example query might be, "All SIP register requests in the last 30 minutes for a specific client IP". Read our documentation for our syslog/logfile analysis.
Packet Capture (PCAP) Tracking
Vodia packet capture tracking captures network traffic at the extension and trunk levels. It enables the download of PCAP files directly from the call log page and TLS key logging for encrypted traffic analysis via the "TLS key log file" setting in the system security section.
Troubleshooting VoIP Calls with Call History (CDRs)
Vodia's tenant Call Log provides detailed CDRs for comprehensive VoIP troubleshooting. Each CDR contains:
Detailed Call Flow to track complete call progression.
SIP Packets capture SIP messaging for each call leg.
CDRQ Statistics presents quality metrics per call leg.
Device Information identifies involved devices.
Related Logs offers supplementary call-specific logging.
The Vodia phone system configures email or SMS alerts for critical PBX events, so users receive timely notifications of any potential issues. To get started check our administrative message notification documentation.
You can also use pre-defined object identifiers (OIDs) for SNMP polling: use pre-defined Object Identifiers (OIDs) for SNMP polling; use snmpget or snmpwalk to retrieve PBX metrics. It’s also possible to integrate with existing monitoring systems (e.g., Nagios - https://www.nagios.org/) to create custom SNMP checks and historical data visualization (such as a Nagios check every five minutes to monitor the number of active calls). SNMP documentation is available here.
External and System-Level Monitoring for the Vodia PBX
To ensure the reliability and performance of your Vodia PBX, we recommend a multi-layered monitoring approach encompassing external port checks, host system metrics, and call testing.
You should always monitor the underlying server or VM hosting the Vodia PBX for resource utilization and potential bottlenecks. For Linux systems, track these metrics:
For environments in which numerous Vodia PBX instances are running across multiple virtual machines, a call testing script identifies SIP connectivity problems: this script simulates calls and reports success or failure. Scheduled periodic execution across all Vodia servers - using Nagios, Icinga, or Prometheus - ensures ongoing health evaluations.
The Industry’s Best Phone System - and the Tools to Keep It Running
We don’t just give you the industry’s best phone system, we also give you the monitoring tools you need to make sure it’s always running at full power, giving your organization impeccable communications while protecting your data and reducing your telephony costs. Find out how we do it, sales@vodia.com, +1 (617) 861-3490.
Business communication is no longer tied to a single device. Desk phones remain valuable for employees who manage high call volumes, mobile apps give remote and travelling teams access to business calling wherever they work, and browser calling fits naturally into computer-based workflows. This article looks at the strengths and limitations of each endpoint, explains which roles they suit best and shows why most organizations benefit from building the right mix rather than selecting one option for everyone.
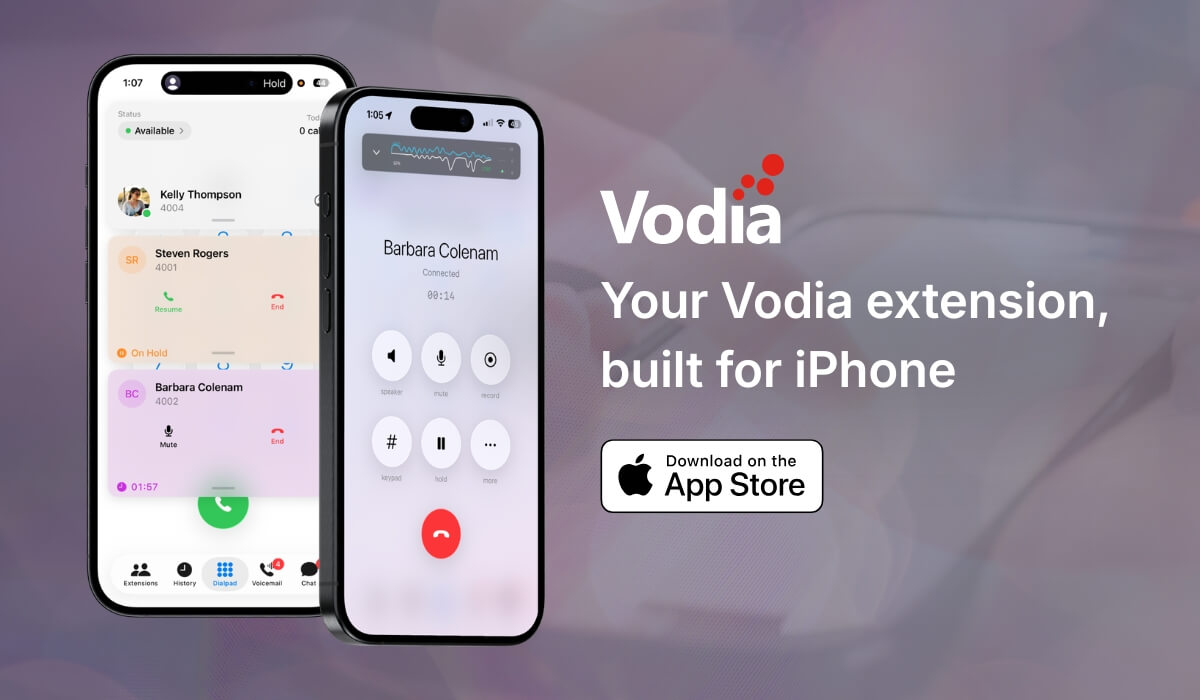
The new Vodia iOS app gives users a native way to use their Vodia PBX extension from iPhone and iPad. Built around a cleaner, card-based interface, the app makes it easier to manage calls, voicemail, chat, extensions, call history, and active call controls in one place. Users can place and receive calls, park or transfer calls, check voicemail, and view extension status from the app. It also adds readiness checks, visual audio feedback, call quality visibility, and adaptive recovery when network conditions change, helping teams stay connected with a reliable mobile PBX experience.
Cloud communications can create a valuable recurring revenue opportunity for MSPs, but only when they remain in control of the customer relationship. By managing branding, pricing, service delivery, and support, MSPs can build stronger customer loyalty, protect long-term account value, and expand their offering as customer needs evolve. A white-label approach also gives them the flexibility to package voice, AI, integrations, and managed services under their own brand.
.svg)