The Queue Overview Analytics Dashboard provides businesses with a powerful tool to monitor and optimize call queue performance. It delivers real-time insights into agent activity, queue metrics, and live call distribution, while also offering historical analytics for trends in call volume, agent efficiency, and abandonment rates. Key features include detailed agent performance breakdowns, configurable historical reporting, interactive charts, and multi-queue monitoring, enabling managers to identify bottlenecks, improve service levels, and enhance overall productivity. With this dashboard, organizations gain actionable data to streamline operations, strengthen internal communications, and drive measurable growth and profitability.
Call queues are how companies of all sizes put callers on hold when there aren’t enough staff members to assist them, particularly during peak call times. Calls that cannot be answered immediately are placed in a virtual line to be answered in order of receipt. A core feature of call handling, call queues inform callers on hold as to estimated waiting times and route calls to the most suitable agent to handle a caller’s inquiry.
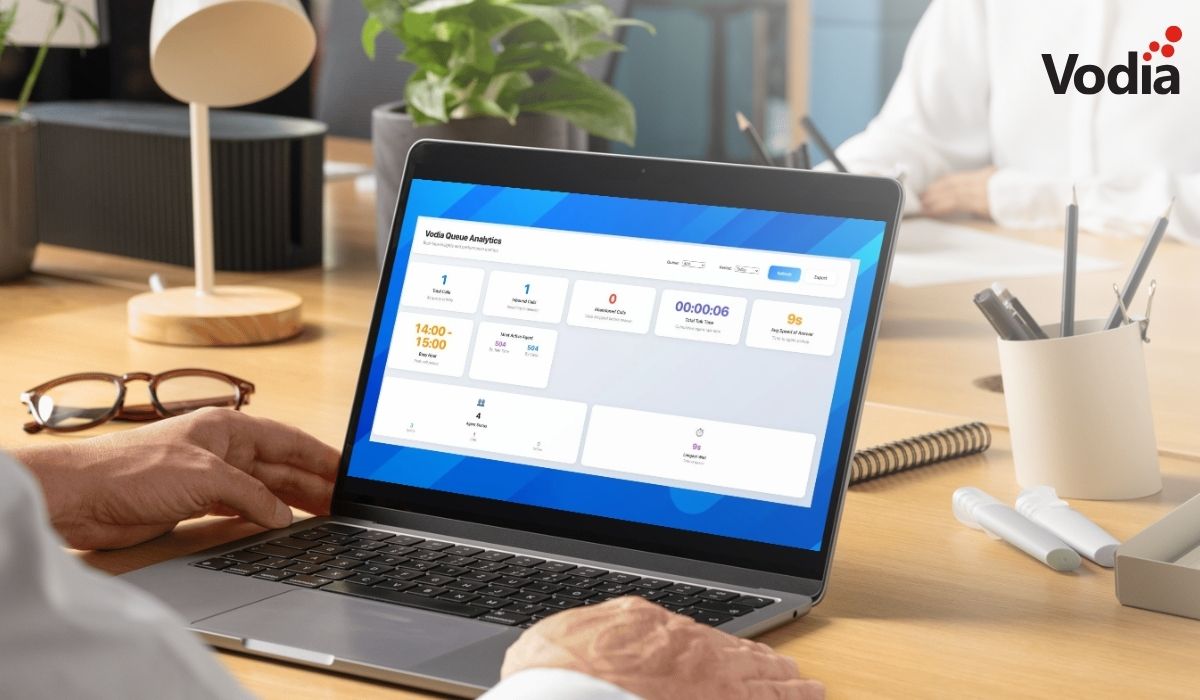
The Vodia Queue Overview Analytics Dashboard
Call queues have always been a core, robust feature of the Vodia phone system, and we are pleased to announce a new call queue feature, the Vodia Queue Overview Analytics Dashboard.
The Vodia Queue Overview Analytics Dashboard provides comprehensive real-time queue performance monitoring and historical analysis: the dashboard delivers actionable insights into queue operations, agent performance, call distribution patterns, and abandonment trends across call center infrastructure.
Key Features of the Vodia Queue Overview Analytics Dashboard
The key features of the Vodia Queue Overview Analytics Dashboard include agent performance analytics, historical analytics engine, interactive data visualization, and real-time queue monitoring:
Agent Performance Analytics
historical agent stats
individual agent breakdowns
performance ranking
status visualization
Historical Analytics Engine
abandonment analysis
call volume trends
configurable time periods
performance tracking
Interactive Data Visualization
abandon rate trends
call volume charts
dynamic chart updates
performance pie charts
Real-Time Queue Monitoring
agent status tracking
live performance indicators
multi-queue support
queue metrics
Chart types and analysis include call volume distribution, performance metrics breakdown, and abandon rate trends.
At Vodia, we are working tirelessly to add features to our industry-standard cloud phone system - this includes giving companies all of the information they need to streamline and strengthen their business communications for improved collaboration, increased profitability, and measurable growth. Find out what the Vodia Queue Overview Analytics Dashboard can do for your organization. Send us an email at sales@vodia.com, or call +1 (617) 861-3490 (United States), +61 2 7201 0788 (APAC), or +49 30 555 78749 (Europe).
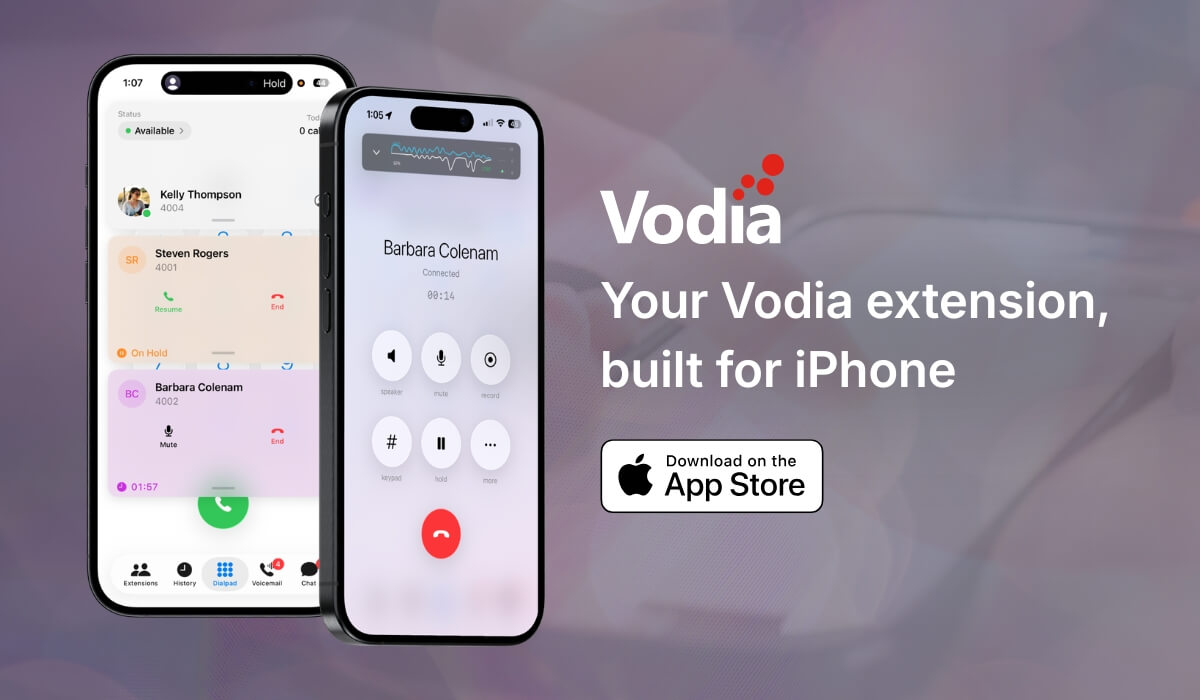
The new Vodia iOS app gives users a native way to use their Vodia PBX extension from iPhone and iPad. Built around a cleaner, card-based interface, the app makes it easier to manage calls, voicemail, chat, extensions, call history, and active call controls in one place. Users can place and receive calls, park or transfer calls, check voicemail, and view extension status from the app. It also adds readiness checks, visual audio feedback, call quality visibility, and adaptive recovery when network conditions change, helping teams stay connected with a reliable mobile PBX experience.
Cloud communications can create a valuable recurring revenue opportunity for MSPs, but only when they remain in control of the customer relationship. By managing branding, pricing, service delivery, and support, MSPs can build stronger customer loyalty, protect long-term account value, and expand their offering as customer needs evolve. A white-label approach also gives them the flexibility to package voice, AI, integrations, and managed services under their own brand.
Helping a business choose the right phone system starts with understanding its real needs... lower costs, better communication, stronger integrations, support for remote teams and more flexibility. For MSPs, asking the right questions makes it easier to recommend the right features, hardware and deployment model, while Vodia provides the technology, partner support and new Partner Portal needed to build stronger customer relationships, create recurring revenue and grow their communications business.
.svg)