For Managed Service Providers (MSPs), monitoring multiple Vodia PBX instances is crucial to ensure high reliability and service quality. Disruptions in voice communication can significantly impact business operations. A structured approach enables the early identification of bottlenecks and the optimization of system performance. Monitoring covers key metrics such as latency, traffic, errors, and resource utilization. Dashboards provide intuitive, actionable insights, while effective alerts facilitate rapid problem resolution. Objectives include improving call quality, minimizing downtime, and optimizing resource usage.
Monitoring Strategy for Vodia PBX: A Best Practices Approach
For Managed Service Providers (MSPs), ensuring the optimal performance and reliability of the Vodia PBX is paramount. Our PBX facilitates voice communication across organizations, and any disruption can significantly impact business operations. This document outlines a comprehensive best practices monitoring strategy tailored to the needs of MSPs. The strategy emphasizes actionable insights, proactive problem detection and continuous improvement.
Monitoring the Vodia PBX: Key Objectives
Ensure Service Reliability: Maintain uptime and performance and minimize communication disruptions.
Identify Bottlenecks: Detect and mitigate issues such as overloaded resources, network latencies, and SIP failures.
Optimize Resource Utilization: Monitor CPU, memory, and network to ensure efficient use of resources.
Improve Call Quality: Track call metrics such as jitter, latency, and packet loss to deliver high-quality voice communications.
Streamline Incident Management: Provide clear, actionable alerts to facilitate quick response and resolution.
The overall objective is to answer questions with monitoring dashboards - these dashboards present comprehensive information as simply as possible.
Best Practices
Our best practices are the foundation for effective monitoring of distributed systems, and they align well with the needs of a PBX. These signals include latency, traffic, errors, and saturation:
Latency: Measure the time taken for calls to connect and the roundtrip time for voice packets. Monitor Real-Time Protocol (RTP) metrics to detect high jitter or delays affecting call quality, use heatmaps to analyze latency trends over time.
Traffic: Track the number of active calls and concurrent SIP registrations, monitor the volume of incoming and outgoing RTP packets to ensure proper handling of communication traffic. Use thresholds to identify peak usage periods and potential overload scenarios.
Errors: Track SIP error codes (e.g., 404 Not Found, 486 Busy Here, 500 Internal Server Error, etc.). Monitor failed registrations and calls rejected due to insufficient resources. Parse and visualize logs for patterns indicating systemic issues.
Saturation: Monitor resource utilization, including CPU, memory, and disk space. Analyze bandwidth usage for SIP and RTP streams. Set alerts for capacity thresholds (e.g., CPU > 80%, disk space < 10% free) to prevent saturation.
Dashboard Design: Best Practices
Effective dashboards provide actionable insights without overwhelming users. Following best practices, consider the following principles:
Focus on Key Metrics
Group metrics by category: system health, call performance, and error analysis.
Use sparklines and gauges for real-time values like active calls and CPU utilization.
Summarize critical data in a top-level overview panel for quick status review.
Provide Context
Show historical trends alongside current data to identify anomalies.
Use annotations to highlight significant events (e.g., software updates, configuration changes, etc.).
Simplify Visualizations
Avoid clutter by limiting the number of panels per dashboard.
Use consistent color schemes to differentiate between normal and critical states.
Enable Drill-Down Capabilities
Link detailed panels to aggregate views for deeper investigation of specific issues.
Include filters for date ranges, SIP client types or geographic regions.
Prioritize Alerts and Notifications
Set up clear, actionable alerts based on thresholds.
Ensure alerts are routed to the appropriate team or service desk.
Monitoring Architecture
To effectively monitor the Vodia PBX, we recommend the following architecture:
Data Collection
Utilize Simple Network Management Protocol (SNMP) for system metrics such as CPU, memory, and bandwidth.
Collect SIP logs and error data via Syslog or API integrations.
Leverage Prometheus for real-time scraping of metrics.
Data Storage
Store time-series data in Prometheus or InfluxDB.
Archive logs in a scalable storage solution (e.g., Elasticsearch or Loki).
Visualization
Use Grafana as the central platform for visualizing metrics and trends.
Configure dynamic dashboards that auto-update based on collected data.
Alerting
Integrate Grafana alerts with existing incident management tools.
Use templates for alert messages to provide detailed issue context.
Sample Use Cases
One important topic is call quality: The Mean Opinion Score (MOS), if available, along with jitter, latency, and packet loss, is mandatory. Heatmaps can be used to visualize call quality over time and across instances and regions.
SIP Registration Failures: Help track the number of failed SIP registrations. Alerts can be created for sustained registration issues that exceed a particular threshold.
Bandwidth Saturation: Helps to indentify potential bottlenecks. Time-series panels can monitor inbound and outbound bandwidth for SIP and RTP traffic.
Continuous Improvement
Monitoring is a matter of learning. PBX operators should periodically test scenarios and the response of the monitoring solution (e.g., for alerting and resume procedures).
Review Metrics Regularly: Conduct periodic reviews to refine the metrics you are monitoring. Add or remove panels based on user feedback. We suggest running a review at least once a year.
Simulate Failures: Perform disaster recovery drills to test alert reliability and response protocols.
Leverage Automation: Use machine learning-based anomaly detection to identify patterns that might not trigger predefined alerts.
By adopting our best practices structured monitoring strategy, MSPs can ensure the reliable operation of Vodia PBX systems, even in distributed complex environments. This approach minimizes downtime, improves call quality, and enhances customer satisfaction by addressing issues before they escalate.
Vodia provides MaaS (Monitoring-as-a-Service) upon request, in case our partners want to focus on customer service instead of monitoring communication services. Get in touch with us, sales@vodia.com or +1 (617) 861-3490, to find out more.
About Vodia
Vodia Networks, Inc. is a pioneering provider of B2B Cloud Communications Solutions catering to enterprises, contact centers and service providers. Vodia's PBX software boasts an extensive suite of business telephony features for on-premise and cloud-based systems and operates seamlessly across Windows, Linux or Mac platforms. Fully compliant with SIP industry standards, the Vodia phone system integrates effortlessly with a wide range of SIP-based devices and trunking providers, granting ultimate freedom in telephony. Vodia’s multi-tenancy platforms are compatible with an unprecedented number of technologies, including desk phones, softphones and APIs, for myriad third-party software and CRM systems. Our mission is to empower our partners and end-users with the world's best cloud PBX and personalized support to ensure their success at every turn. Our US headquarters are in Boston and our European headquarters are in Berlin; we also maintain offices in Beijing, Hong Kong, Nicosia (Cyprus) and Sydney, Australia. Visit Vodia on LinkedIn, X and YouTube.
Moving your business phone system to the cloud can improve flexibility, scalability, mobility, and access to modern communication tools, but a successful migration still requires careful planning. From bandwidth and hardware compatibility, disaster recovery, staff readiness, and MSP support, there are several areas businesses need to assess before deployment. Understanding these common risks early can help reduce disruption, avoid unexpected costs, and create a more reliable cloud communication environment.
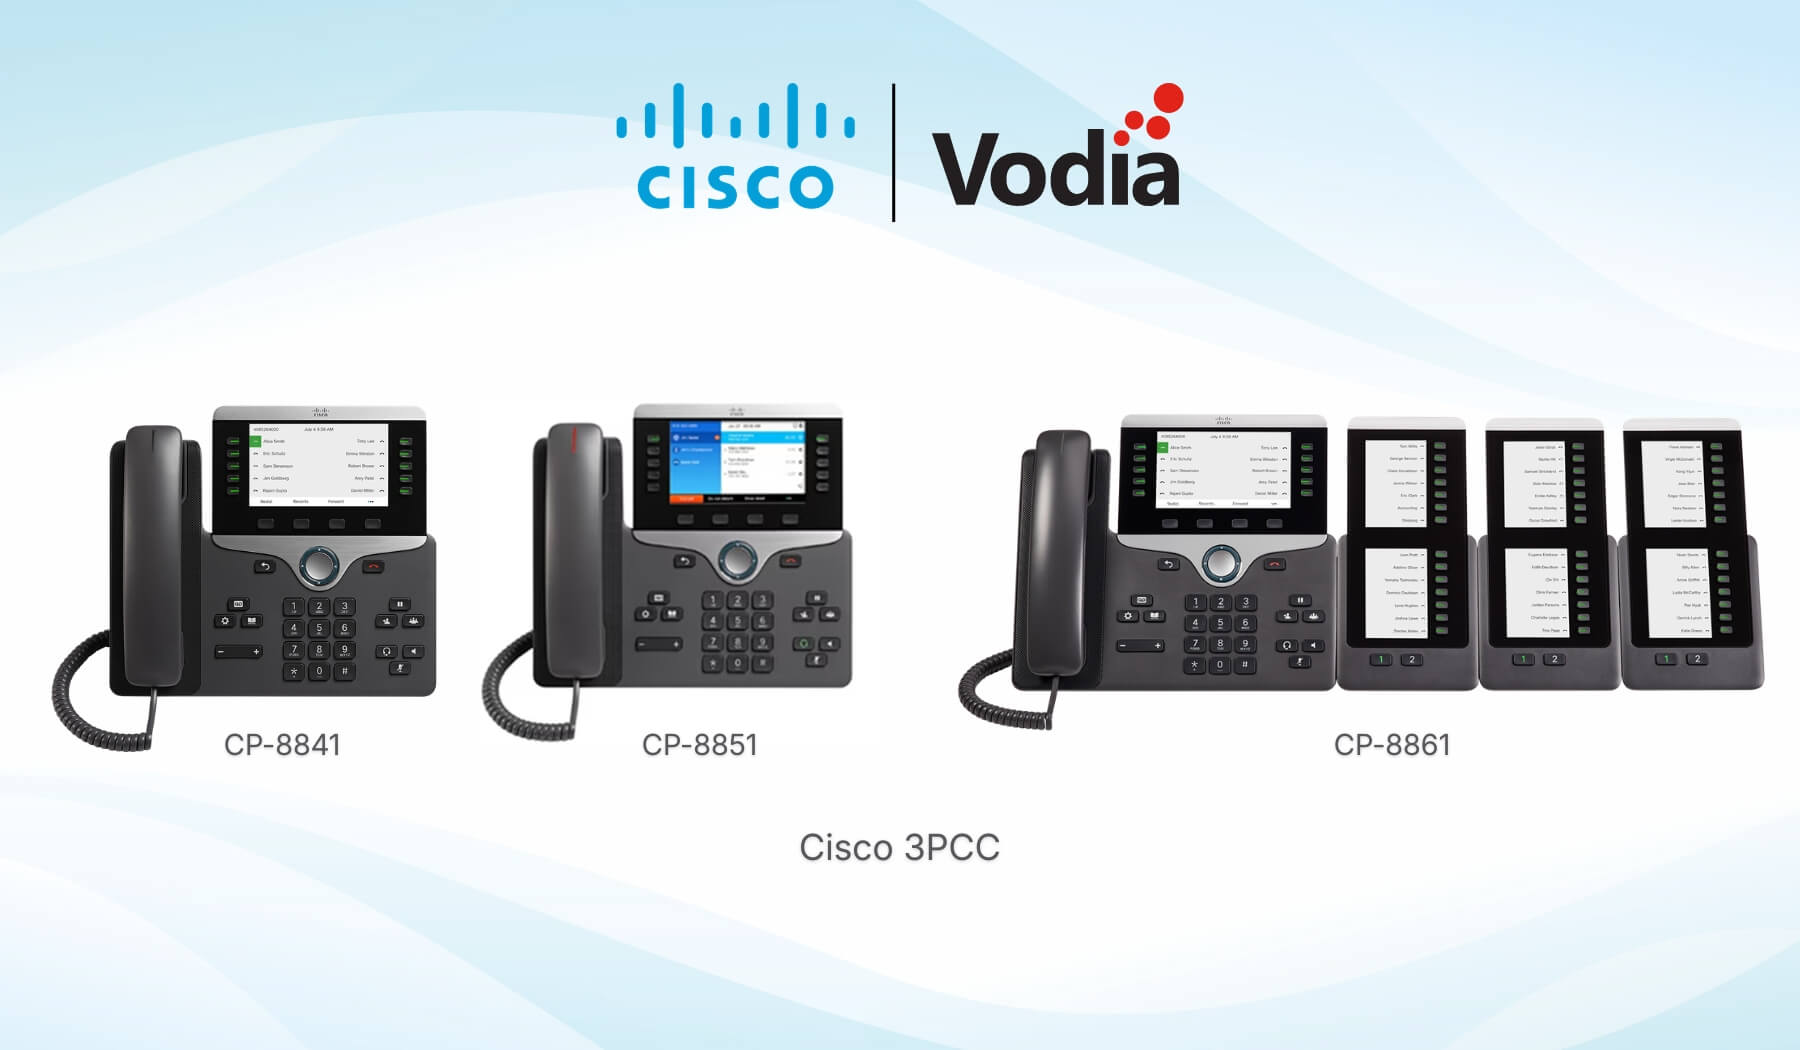
Vodia now supports provisioning for Cisco 3PCC phones, giving businesses and service providers a clearer way to connect compatible Cisco multiplatform IP phones to the Vodia PBX. Admins can add supported Cisco devices through Vodia Device Management, pair them with extensions, and configure provisioning settings through the phone’s web interface. This expands Vodia’s supported device ecosystem while helping customers continue using trusted Cisco IP phones within their existing business phone system.
Vodia Hub for Windows brings click to call and desktop call control to Windows, making it easier for users to place, answer, manage, and automate calls from the applications they already use every day. With system wide tel: link handling, inbound call screen pops, queue details, and automation support, Vodia Hub helps connect the Vodia PBX with Outlook, CRMs, browsers, documents, and other Windows tools. Users can keep working without manually copying phone numbers, opening the user portal, or switching between applications just to handle a call.
.svg)