.svg)
Surveillez votre infrastructure PBX en temps réel
Visibilité centralisée sur les serveurs, les locataires et les systèmes, depuis une interface unique, avec un aperçu clair de l'état, de l'activité et des performances du système.
Un système de surveillance centralisé pour votre environnement PBX
Vodia Monitor se connecte à vos systèmes PBX et agrège les données opérationnelles dans une interface unique. Au lieu de vérifier chaque système individuellement, vous obtenez une vue unifiée des performances, de l'activité et de l'état du système sur toutes les instances connectées.
Il est conçu pour les environnements avec plusieurs PBX et locataires, vous offrant une visibilité cohérente sur les déploiements distribués.

Serveurs et services PBX
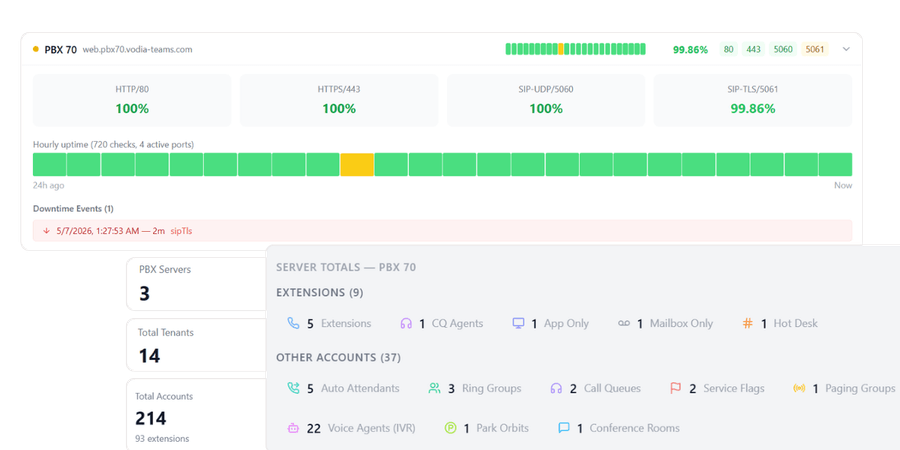
Surveillez l'état et la santé des serveurs PBX, des services et des composants essentiels en temps réel.

Vue d'ensemble du parc et des systèmes
Visualisez et gérez plusieurs systèmes PBX depuis une seule interface avec une vue d'ensemble claire de leur état.

Alertes et surveillance de la disponibilité
Recevez des notifications en cas de problèmes, des pannes de service aux comportements inhabituels de votre système.

Environnements multi-systèmes
Suivez plusieurs systèmes et environnements tout en gardant les données séparées et contrôlées.
Surveillez chaque composant de votre infrastructure PBX
Suivez les serveurs, les jonctions, les appareils, les ports, les certificats, la disponibilité et les événements de sécurité en un seul endroit pour voir rapidement ce qui fonctionne et ce qui nécessite une attention particulière.

État des serveurs et des services

Jonctions et connectivité

Appareils et points d'accès

État des ports et du réseau

Certificats et sécurité

IPs bloquées et menaces
Surveillez plusieurs systèmes PBX depuis un seul endroit
Suivez l'état du système, la disponibilité et l'activité sur toutes les instances PBX connectées sans basculer entre les interfaces.
Comprenez l'activité sur plusieurs locataires
Obtenez une visibilité sur l'utilisation et les performances au niveau du locataire sur l'ensemble des systèmes pour mieux comprendre le comportement dans les environnements multi-locataires.

Détectez les problèmes avant qu'ils n'affectent votre système
Définissez des conditions d'alerte et recevez des notifications lorsque le comportement du système change, vous permettant de réagir rapidement aux pannes de service, aux problèmes de connectivité ou à une activité anormale.

Alertes en temps réel
Recevez des notifications lorsque les services tombent en panne, que les connexions sont interrompues ou que les seuils sont dépassés.

Suivi historique
Examinez les événements passés et les changements système pour comprendre ce qui s'est passé et pourquoi.

Surveillance de la disponibilité
Suivez la disponibilité du système et assurez-vous que votre PBX reste opérationnel.
Analysez les tendances et investiguez les problèmes au fil du temps
Combinez la surveillance en temps réel avec les données historiques pour comprendre les schémas, identifier les problèmes récurrents et dépanner les événements passés.
Identifier les problèmes récurrents
Comprendre les tendances à long terme
Dépannage des incidents passés
Identifiez les valeurs aberrantes et priorisez les actions
Utilisez les classements et les analyses système pour identifier rapidement les anomalies et vous concentrer sur ce qui nécessite une attention particulière.

Conçu pour la visibilité sur tous les systèmes et environnements
Accédez à des tableaux de bord structurés qui offrent une vue d'ensemble claire de l'activité, des performances et de l'état de santé de votre infrastructure PBX.
Vue d'ensemble du parc
Visualisez tous les systèmes PBX en un seul endroit avec des indicateurs de statut clairs et un accès rapide aux détails.

Surveillance assistée par l'IA
Générez des rapports de santé synthétiques et identifiez les problèmes d'infrastructure sur l'ensemble des systèmes PBX grâce à l'analyse assistée par l'IA.

Classements et analyses
Comparez les systèmes en fonction de leurs performances, de leur disponibilité et de leur activité pour identifier rapidement les problèmes.

Gestion centralisée
Accédez aux données de surveillance, aux alertes et à l'état du système pour tous les systèmes PBX à partir d'un seul endroit.

Conçu pour le contrôle et l'évolutivité
Vodia Monitor est conçu pour les environnements où plusieurs systèmes, locataires et services doivent être surveillés en continu.

Accès basé sur les rôles
Contrôlez qui peut consulter et gérer les données de surveillance. Attribuez des rôles aux différentes équipes tout en alignant la visibilité sur les responsabilités.
Surveillance centralisée multi-PBX
Surveillez plusieurs systèmes PBX à partir d'une interface unique. Agrégez les données de tous les serveurs et locataires sans basculer entre les systèmes.

Déploiement indépendant
Fonctionne comme un système distinct qui se connecte à vos instances PBX pour collecter et agréger les données, sans affecter les opérations PBX.
Basé sur une infrastructure PBX éprouvée
20
490
110
45
75
De la surveillance à l'
Passez de la simple observation de vos systèmes à leur compréhension et à leur amélioration. Grâce à une visibilité centralisée, des alertes et des analyses historiques, vous pouvez détecter les problèmes plus rapidement et y répondre en toute confiance.

Questions fréquentes
Qu'est-ce que Vodia Monitor ?
Que surveille Vodia Monitor ?
Vodia Monitor peut-il gérer plusieurs systèmes PBX ?
Puis-je surveiller les locataires sur plusieurs systèmes PBX ?
Comment fonctionnent les alertes dans Vodia Monitor ?
Puis-je consulter les données historiques et la disponibilité ?
Comment Vodia Monitor est-il déployé ?
Quelle est la différence entre Vodia Monitor et Vodia Analytics ?
Anticipez les problèmes sur l'ensemble de votre infrastructure PBX
Protégez votre entreprise grâce à un système téléphonique qui assure une communication fluide et sans tracas. Notre équipe est là pour vous aider à chaque étape.
Vous voulez explorer par vous-même ? Lancez une instance prépayée prête à l'emploi sur :