Integrating Prometheus with Vodia PBX enables effective monitoring of your phone system’s performance. Start by creating an API account on Vodia PBX to grant access to Prometheus, followed by the installation of Prometheus on DigitalOcean. Update the prometheus.yml file to include your PBX as a target by configuring the DNS, username, and password. Explore the Vodia API for available system stats, such as CPU usage and memory. Finally, create custom stat panels in Prometheus to visualize and track these key performance metrics in real time.
Prometheus is an open-source monitoring and alerting toolkit that is part of the Cloud Native Computing Foundation. By integrating it with Vodia PBX, you can effectively monitor and manage your phone system's performance. Here’s how to get started:
Step 1: Create an API Account on Vodia PBX
To allow Prometheus to access Vodia PBX data, you need to create an API account. Follow these steps:
Log in to Vodia PBX as an Administrator:
Navigate to the system level where you can manage user accounts.
Create a New User Account for API Access:
Go to the Administrator section.
Create a new account with the following details:
Account: Choose a user name.
API Access: Enable API access.
Type: Set the account type to Regular.
Password: Set a strong, secret password.
Save the Configuration:
Save the user account configuration.
Keep the username and password handy, as you will need them for Prometheus to access Vodia PBX data.
Once your server is set up, you can access the Prometheus user interface by going to http://your_server_ip:9090/
Setting up the .yml file
By default, Prometheus is set up to monitor itself and Node Exporter. To monitor more systems, you need to update the configuration file located at: /etc/prometheus/prometheus.yml
3 things need to be changed in the Prometheus .yml file config file
targets: ['123.vodia.com'] Here is where you will set the target - in this case it will be your PBX DNS name
username: 'prometheus'
password: 'prometheus'
Note: Do not remove the ' ' and [ ] in the config file leave it as is and change the value
Once you have edited the config file, you can modify the prometheus.yml using nano or any edit you desire by copy-pasting the config or simply creating a new .yml file and renaming the old file.
Restart the service by sudo systemctl restart prometheus
Check the Prometheus and click on System Stats - this will show all of the available APIs for Prometheus, and you will see an Example Response. Click on "view more" and it should look like this:
I have bolded all of the stats you can use as an examples, there's no need to copy the whole thing
# pbxctrl 69.3.2.beta
# HELP system_cpu_srv_max Peak usage of the CPU # TYPE system_cpu_srv_max gauge system_cpu_srv_max 0 1719852690061
# HELP system_cpu_srv_avg Average Load # TYPE system_cpu_srv_avg gauge system_cpu_srv_avg 0 1719852690061
# HELP system_cpu_ctrl_max Peak usage of the CPU # TYPE system_cpu_ctrl_max gauge system_cpu_ctrl_max 25 1719852690061
# HELP system_cpu_ctrl_avg Peak usage of the CPU # TYPE system_cpu_ctrl_avg gauge system_cpu_ctrl_avg 2 1719852690061
# HELP system_memory_all Total # TYPE system_memory_all gauge system_memory_all 172928 1719852690061
Creating a stat panel on Prometheus
Click "add panel" and enter the Vodia API cmd - in this case system_cpu_srv_max, then press execute: you can create many panels to monitor the PBX.
Vodia Hub brings click to call and desktop call control to Windows, making it easier for users to place, answer, manage, and automate calls from the applications they already use every day. With system wide tel: link handling, inbound call screen pops, queue details, and automation support, Vodia Hub helps connect the Vodia PBX with Outlook, CRMs, browsers, documents, and other Windows tools. Users can keep working without manually copying phone numbers, opening the user portal, or switching between applications just to handle a call.
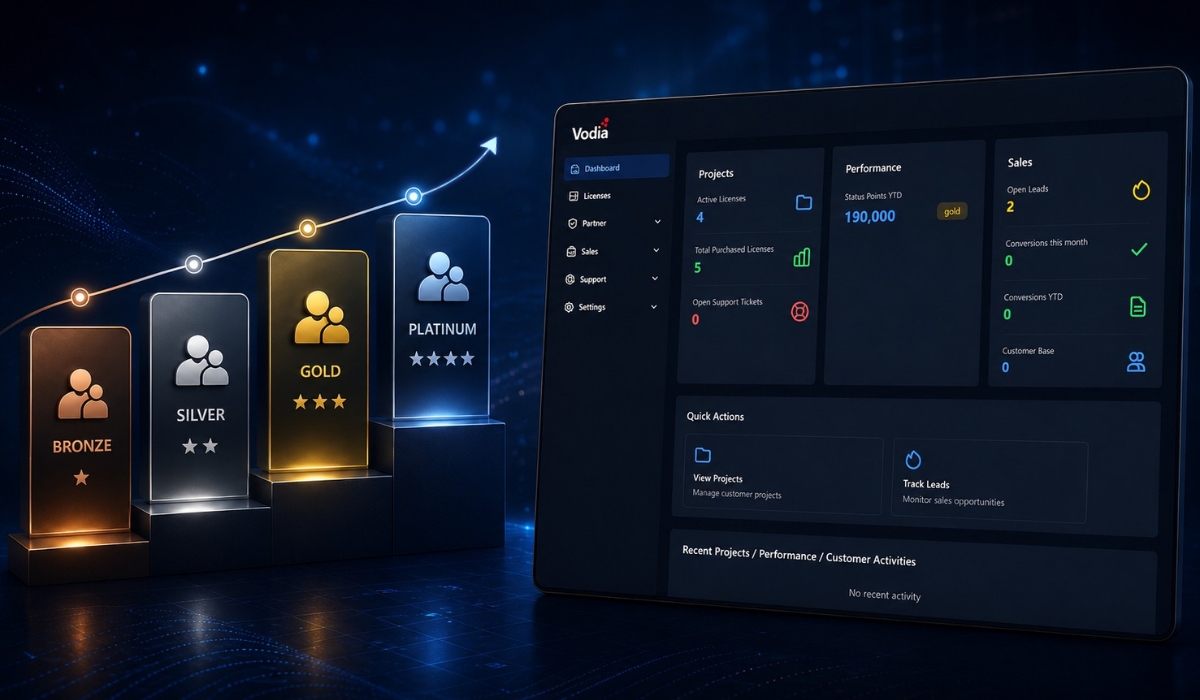
The Vodia Partner Program and new Vodia Partner Portal give service providers, MSPs, system integrators, and technology partners a clearer way to grow their Vodia business. Partners can earn status points through revenue, certifications, customer acquisition, referrals, and other activities, then use those points to progress through partner levels and unlock higher discounts. The launch also includes a limited-time Summer Launch Promotion, giving new partners a faster path toward Gold status and a 20% discount.
V70 of the Vodia PBX introduces flexible service flags that help organizations automate call routing, scheduling, queue management, announcements, and communication workflows throughout the day. Service flags can be configured manually or automatically to control how calls are handled during business hours, after hours, holidays, or special events. They can also be chained together for more advanced routing logic and integrated with external calendars such as Google Calendar to support dynamic scheduling and operational flexibility across business environments.
.svg)